

35 Key Candlestick Patterns Explained with PDF
Discover 35 must-know candlestick patterns 📈 for smarter trading! Grab the handy PDF📄 to spot trends and boost your market skills today.
Edited By
James Mitchell
Understanding candlestick patterns is a must for traders navigating the Nigerian markets. From stocks listed on the Nigerian Exchange (NGX) to forex and crypto trading on local fintech platforms like Paystack or OPay, these visual signals give you a clearer idea of price movements and potential reversals.
Candlestick charts represent price action over a specific period, showing the open, close, high, and low. Unlike simple line charts, candlesticks reveal trader behaviour such as indecision, strength, or weakness behind market moves. Learning to read these patterns lets you anticipate next price steps rather than just reacting.
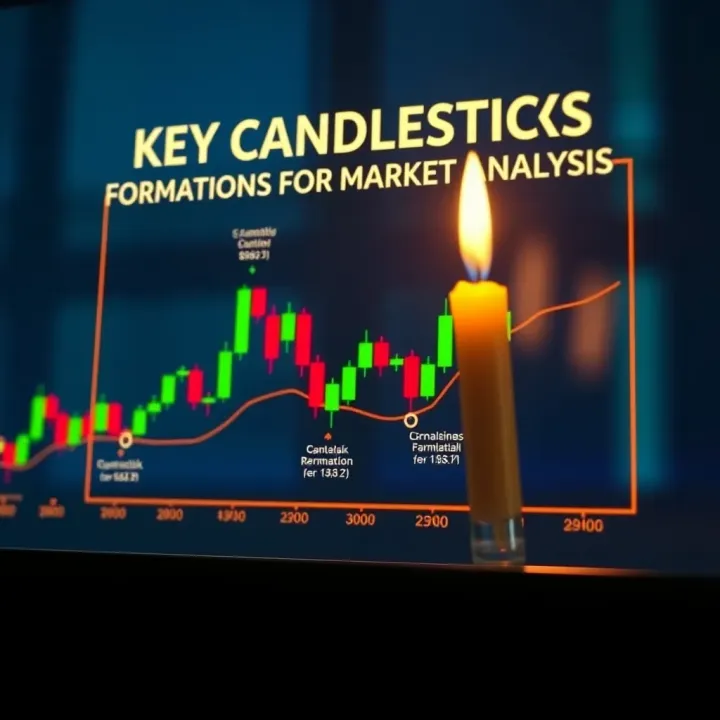
Remember, candlestick patterns do not guarantee outcomes but improve your probability of success when combined with volume data, trend analysis, and Nigerian market context.
Some common patterns Nigerian traders should know include:
Doji: Indicates market indecision when open and close prices are nearly the same. Dojis often appear before trend reversals.
Hammer: Has a small body with a long lower wick, signalling a possible bullish reversal after a downtrend.
Engulfing: When a bullish candle completely covers the previous bearish candle or vice versa, it highlights strong momentum in that direction.
Spotting these patterns on your favourite trading app helps you make smarter entries and exits. For instance, if you catch a hammer forming on an NGX stock during a downtrend, it might be time to reconsider selling or plan a buy order.
In the next section, you will find practical examples and tips specific to Nigerian trading environments, such as how to use candlestick insights alongside JSE data or fintech trading indicators. This cheat sheet isn’t about guesswork; it’s about giving you straightforward tools to sharpen your trading strategy and increase your chances of profits.
Candlestick charts are essential tools that traders use to understand price movements at a glance. In the Nigerian trading environment, where market conditions can be volatile due to currency fluctuations and economic events, candlestick charts offer a clear visual way to interpret what buyers and sellers are doing. Unlike simple line charts, candlesticks give you detailed information on four key metrics: open, high, low, and close prices within a specific trading period. This depth helps traders make better decisions on NGX stocks, forex pairs like USD/NGN, or crypto assets.
Each candlestick represents a specific time frame — could be one minute or one day. The open is the price when trading starts, while the close is where price ends for that period. High marks the peak price achieved, and low shows the lowest traded price. For instance, if a stock like MTN Nigeria opened at ₦220, traded as high as ₦225, dropped to ₦215, then closed at ₦218, these values form the skeleton of the candlestick.
Knowing these values gives a concrete snapshot of market activity and momentum within each interval. A stock opening high and closing low usually indicates selling pressure, while an opposite movement suggests buying interest.
The body of the candlestick shows the difference between open and close prices. A long body means strong movement — either bulls dominating when price closes above open or bears if below. The colour coding (green or white for up, red or black for down) makes it easier to spot.
The wicks (also called shadows) are the thin lines extending above and below the body, showing the high and low extremes for the period. Long upper wicks suggest sellers pushed prices down from higher levels, while long lower wicks indicate buyers defending lower prices. Nigerian traders often watch these wicks for clues, especially in markets with sudden volatility caused by fuel subsidy news or Central Bank policies.
Candlestick patterns reveal underlying market emotions. For example, a hammer candle with a long lower wick and small body typically signals fear giving way to optimism. Traders on the NGX or forex markets read these patterns to gauge when buyers are becoming aggressive or when sellers may soon give up. This helps avoid jumping into trades based on rumours or incomplete info.
Certain patterns warn traders about shifts in direction. A bullish engulfing pattern after a downtrend hints at a reversal — meaning prices could rise soon. Conversely, a shooting star at the top of an uptrend warns of potential price decline. Nigerian markets, known for sharp moves after political announcements or oil price shocks, often show these signs clearly.
Besides reversals, candlesticks also confirm continuity of trends. Patterns like marubozu candles with full bodies and no shadows suggest the current trend still has strength.
Candlestick charts are versatile across exchange platforms like NGX for stocks, forex brokers for USD/NGN trading, and crypto markets dealing in Bitcoin or Binance Coin. Each market has its characteristics, but candlestick principles remain the same. For instance, in crypto, sudden spikes produce long wicks due to volatility; in stocks, steady movement creates clearer body patterns.

Nigerian traders who combine candlestick readings with local factors like naira stability and government policy reports gain an edge. Whether you trade Zenith Bank shares or speculate on cryptocurrency exchanges, understanding candlestick charts tightens your timing and risk management.
Reading candlestick charts is like watching the heartbeat of the market. They reflect the constant tussle between buyers and sellers, especially important in the fast-changing Nigerian trading scene.
Mastering key single-candlestick patterns is vital for Nigerian traders aiming to read market movements with precision. These patterns encapsulate immediate market sentiment within one trading session, making them quick markers of potential reversals or continuations. Whether you trade stocks on the NGX or currencies via local fintech apps, recognising these candles helps you time entries and exits more sharply.
Standard Doji
A standard Doji forms when the opening and closing prices are nearly identical, creating a cross-like shape. This pattern represents indecision among traders because neither bulls nor bears could dominate that session. In Nigerian markets, spotting a Doji after a strong trend may signal a pause or subtle shift in momentum. For instance, if an NGX stock has surged sharply but closes with a Doji, it suggests buyers might be tiring.
Dragonfly and Gravestone Doji
These are special Doji types where the shadows tell more. A Dragonfly Doji has a long lower wick but little or no upper wick, indicating buyers pushed prices back up after sellers drove it down. This can hint at bullish support, particularly valuable when trading volatile forex pairs like USD/NGN. On the flip side, a Gravestone Doji shows a long upper wick and almost no lower shadow. It suggests sellers returned strongly after an initial rally, warning of bearish resistance.
Interpretation in Price Action
Doji patterns often speak of market hesitation and can be the first sign that a trend is weakening. However, their message gains strength only when paired with confirmation on subsequent candlesticks or volume changes, especially in Nigeria’s often choppy market conditions. For example, a Doji followed by a strong bullish candle could be your cue to buy, while one followed by a bearish candle may warn of declines.
Identifying these patterns
Both Hammer and Hanging Man candles look alike: a small body near the top of the range and a long lower shadow. The distinction lies in their context. A Hammer occurs after a downtrend, signalling potential bullish reversal as buyers step in. Conversely, a Hanging Man appears after an uptrend, hinting at possible selling pressure, despite previous bullish strength. Being clear on trend direction before interpreting these patterns is key.
Implications for Bullish and Bearish Trends
In practice, a Hammer on an NGX blue-chip stock—say MTNN—could mean a good time to consider buying if volume supports it. Meanwhile, a Hanging Man appearing after a rally might prompt caution or partial profit-taking. It’s worth noting that these patterns alone shouldn’t dictate trades; they serve as an early warning system needing backup from other indicators such as moving averages or RSI.
Characteristics of Indecision Candles
Spinning Tops feature small bodies with relatively long upper and lower wicks. This shape shows a tug-of-war between buyers and sellers, resulting in indecision. For Nigerian traders, seeing a Spinning Top after a strong trend—like in forex or crypto markets—calls for a closer look before committing capital, as it often hints the current trend may lose steam.
Strong Momentum Indicators
On the other hand, Marubozu candles have no wicks and full bodies, signalling decisive momentum. A bullish Marubozu implies strong buying interest from open to close, while a bearish one shows persistent selling pressure. For example, a bullish Marubozu on Nigerian banks’ stocks during earnings season can signal confident investor sentiment and potentially sustained price rises.
Recognising and understanding these single-candlestick patterns equips traders with faster insights into market shifts, increasing chances to make timely and profitable decisions. Still, integrating them with broader market analysis and risk management remains essential.
Multi-candlestick patterns are valuable tools many Nigerian traders use to confirm market sentiment and anticipate price moves. Instead of relying on single candles, these patterns show how multiple candles interact, revealing stronger clues about potential trend direction or pauses. For instance, combining these signals with local market knowledge such as Nigerian Stock Exchange (NGX) stock behaviour or forex pairs like USD/NGN can improve decision-making significantly.
Bullish engulfing occurs when a smaller bearish candle is followed by a larger bullish candle that completely covers the previous body. This pattern suggests strong buying pressure entering the market. Say a stock like Dangote Cement on NGX forms this pattern after a downtrend; it can indicate buyers are stepping in, likely leading to a price rise. Traders often use it as an entry point or to confirm a bullish reversal.
Bearish engulfing is the opposite: a smaller bullish candle followed by a larger bearish candle that engulfs it. This signals a shift to selling pressure. For example, if the Zenith Bank share price has been rising and then forms this pattern, it might be a warning that sellers are gaining strength, signalling a possible downtrend. Nigerian traders using this cue can adjust their portfolio or consider stop losses.
Using Engulfing Patterns to Confirm Trend Changes allows traders to avoid false signals. After spotting an engulfing candle, checking volume and other indicators like RSI or moving averages helps confirm if the trend is indeed reversing. For instance, if a bullish engulfing is accompanied by rising volume and the NGX index support level holds, it strengthens confidence in a breakout. This approach helps avoid getting caught in short-term noise.
Recognising the Three-Candle Setup is key here. The Morning Star starts with a large bearish candle, followed by a small indecisive candle—often a doji or spinning top—and then a strong bullish candle. The Evening Star mirrors this but signals a bearish reversal. Nigerian traders seeing this on stocks such as Guaranty Trust Bank or forex pairs may prepare for a change in momentum.
Signals for Trend Reversal and Continuation from these patterns are quite reliable if confirmed by volume or support/resistance zones. A Morning Star near a key support level suggests a bullish reversal, while an Evening Star near resistance could hint at a drop. These give traders actionable signals to enter or exit trades in response to market shifts.
Bullish and Bearish Harami patterns feature a large candle followed by a smaller body completely within the prior candle’s range. A bullish harami forms after a downtrend, signalling hesitation among sellers and possible upside ahead. Conversely, a bearish harami after an uptrend suggests buyers may be tiring. For example, an oil sector stock like Oando may show this during consolidation phases.
Significance in Market Pauses: Haramis often indicate the market pausing to catch its breath before the next move. Nigerian traders should watch these carefully, especially during volatile ember months when external factors can disrupt trends. Combining harami patterns with volume or news events provides clarity on whether the market will restart its previous trend or reverse.
Multi-candlestick signals give Nigerian traders more context and reduce guesswork, especially when combined with local market factors and technical indicators.
These patterns, when properly understood and applied, can sharpen your trading edge in NGX stocks, forex, or crypto assets handled on Nigerian platforms. Watch out for confirmation signals and avoid relying on single patterns without context.
Using candlestick patterns effectively requires understanding how local market conditions affect their reliability and interpretation. Nigerian markets, with their unique factors—like political events, economic policies, or even social happenings—often influence price actions beyond what technical charts alone show. Traders must adjust their analysis accordingly to avoid misleading signals.
Local events such as fuel subsidy announcements, changes in monetary policy by the Central Bank of Nigeria (CBN), or election-related news often trigger sharp movements in NGX stocks and currency pairs. These events can cause candlestick patterns to behave differently compared to more stable markets. For instance, a bullish engulfing pattern could be quickly overridden by sudden policy shifts, making it less reliable unless confirmed by other factors.
Consider the Nigerian Naira (₦) against the US dollar, where fluctuations often reflect foreign reserve changes or trade balances. When a candlestick pattern indicates a reversal, it’s wise to check if a local event might have influenced this move before acting. For NGX stocks like Dangote Cement or MTN Nigeria, sudden volume spikes and pattern formations may coincide with quarterly earnings reports or regulatory actions, which are crucial to factor in.
Support and resistance levels help confirm candlestick signals by showing price zones where buying or selling pressure is historically strong. For example, if a morning star pattern appears near a well-established support level on an NSE stock, it strengthens the chance of a bullish reversal, giving a Nigerian trader more confidence in entering a position.
Combining patterns with moving averages and oscillators like the Relative Strength Index (RSI) improves decision-making. A hammer forming above the 50-day moving average, coupled with RSI below 30 signalling oversold conditions, suggests a high probability of upward price movement. These layers of analysis help traders avoid traps and false signals common in volatile Nigerian markets.
One frequent error is over-relying on single patterns without context. Candlestick patterns must be part of a larger strategy including trend analysis and confirmation. Nigerian traders might see a doji candle and expect an immediate reversal without considering the overall market direction, leading to premature trades that often fail.
Ignoring volume and market conditions is another pitfall. Volume shows the strength behind price moves. A bullish pattern with low volume on a stock like Guaranty Trust Bank (GTBank) may lack conviction, suggesting caution before entering a buy position. Market conditions such as high volatility in ember months or during major political announcements can produce erratic candlestick formations, making it essential to interpret patterns within the bigger picture.
Successful trading on Nigerian markets demands combining candlestick insights with local knowledge, other technical tools, and smart risk management to navigate the unique twists these markets present.
A summary and quick reference cheat sheet acts as your trading guidepost, especially when the market moves fast. Nigerian traders juggling stocks on the Nigerian Exchange Group (NGX), forex, or crypto need a reliable snapshot of the most relevant candlestick patterns. This section consolidates key shapes and what they usually indicate, cutting down your analysis time. It’s like having a well-organised tool kit: when you see a pattern like a hammer or an engulfing candle, you can instantly recall its meaning and prepare your next move.
This cheat sheet simplifies complex charts by presenting patterns at a glance, accompanied by clear explanations. It also highlights the market context behind each signal — for example, why a bullish engulfing pattern in a blue-chip NGX stock like Dangote Cement might behave differently from the same formation in volatile forex pairs such as USD/NGN. Such quick access encourages confident, timely decisions, which can make the difference between profit and loss.
Visual aids are critical in mastering candlestick patterns because this is a graphic language of trading. Each pattern’s shape, including body length and wick size, tells a story about market sentiment during the trading session. By studying illustrations side-by-side, traders better distinguish subtle differences — whether it’s a doji signalling market indecision or a marubozu suggesting momentum.
Clear visuals also help cement pattern recognition under real trading pressure. For instance, spotting a morning star pattern early on a price chart requires familiarity with the three-candle setup — one bearish, one small-bodied or doji, and one bullish candle. Illustrations make these details stick, improving accuracy in real time.
Bullish signals often indicate a potential upward price movement. Patterns like the hammer, bullish engulfing, and morning star suggest buyers are gaining control, pushing prices higher after a downtrend. Nigerian traders can watch for these during bear phases in sectors like banking or consumer goods, as they may signal profitable entry points.
Bearish signals hint at possible declines. The hanging man, bearish engulfing, and evening star appear when sellers start overwhelming buyers. Recognising these patterns early is crucial, especially with sectors sensitive to economic shifts such as oil & gas or telecoms, to curb losses or plan short sales.
Neutral and indecisive formations like spinning tops and dojis show a tug-of-war in market forces, where neither buyers nor sellers dominate. These often precede trend reversals or pauses, so Nigerian traders should avoid making hasty decisions at these points and instead watch for confirmatory signals or volume changes before acting.
Keeping a focused cheat sheet for these patterns helps Nigerian traders respond promptly to ever-changing markets, combining local knowledge with technical precision for better outcomes.
Discover 35 must-know candlestick patterns 📈 for smarter trading! Grab the handy PDF📄 to spot trends and boost your market skills today.
📈 Master seven key chart patterns every trader should know to spot market trends and price moves. Boost your trading edge with expert tips and examples!
📊 Master all candlestick patterns to spot market shifts confidently. Essential for Nigerian traders aiming to enhance their trading decisions with clarity.
📈 Master 35 powerful candlestick patterns to read market moves confidently. Perfect for traders seeking clear, practical tips plus a handy PDF download.
Based on 10 reviews