
35 Key Candlestick Patterns Explained with PDF
Discover 35 must-know candlestick patterns 📈 for smarter trading! Grab the handy PDF📄 to spot trends and boost your market skills today.
Edited By
Emily Harrison
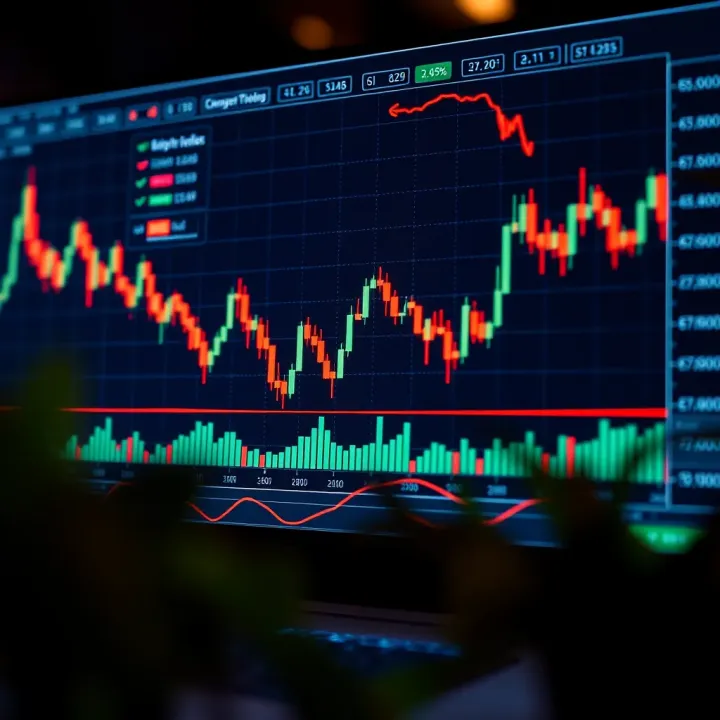
Understanding candlestick patterns is essential for traders aiming to make informed decisions in the Nigerian market. These patterns visually represent price movements on charts, helping to predict potential trends or reversals. Unlike just relying on indicators, candlestick analysis offers clear, actionable signals directly from market behaviour.
Candlestick charts show four critical data points for each trading period: open, high, low, and close prices. Nigerian traders often encounter volatile conditions, driven by factors such as naira fluctuations and fuel price changes, making candlestick patterns particularly useful as they react swiftly to price changes.

Some patterns are more reliable than others. For example, the hammer signals a possible bullish reversal when it appears after a downtrend. Conversely, the shooting star often indicates bearish pressure after an uptrend. Recognising these can guide you to enter or exit trades more confidently.
Remember, no single pattern guarantees success. They perform best when combined with other tools such as volume analysis, support and resistance levels, and market news relevant to Nigeria's economy.
To maximise benefits, Nigerian traders should familiarise themselves with the following points:
Context matters: Confirm patterns within the overall market trend.
Volume confirmation: Stronger patterns often accompany increased trading volume.
Risk management: Use stop-loss orders to protect against sudden market swings often seen in Nigerian shares or currency pairs.
This guide will break down these patterns with practical examples relevant to the Nigerian stock exchange (NGX) and forex markets, helping you trade smarter in local conditions.
Candlestick patterns are essential tools for traders looking to read price action and anticipate market moves. They condense complex price data into visual signals, helping traders make decisions fast without sifting through numbers alone. For Nigerian traders dealing with volatile markets and often unexpected swings, these patterns provide a straightforward way to interpret buyer and seller behaviour.
Candlestick patterns are formations created by one or more candlesticks on a chart. Each candlestick represents the price action within a set period, showing the opening, closing, high, and low prices. When these candles form distinct shapes or sequences, they signal possible continuation or reversal of trends. For example, a Hammer pattern suggests buyers are stepping in after sellers pushed prices lower, hinting at a potential price rise.
At their core, candlestick charts mirror the tug-of-war between bulls and bears. A long green candle indicates strong buying interest, while a long red candle shows sellers dominating. Patterns combining several candles can reveal sentiment shifts before price changes become clear. In Nigerian markets, where news like CBN policy changes or oil price fluctuations affect sentiment sharply, candlestick charts act like a quick mood check. They show when traders are confident or nervous, which helps you gauge entry or exit points precisely.
"Candlestick patterns reflect the psychology behind price moves, turning raw data into insights about market emotions and future directions."
In Nigeria, traders face unique challenges: currency fluctuations, irregular market hours, and liquidity issues especially in equities and forex. Candlestick patterns provide clarity amid this unpredictability. They work well even with limited data and on popular platforms like MTN Stockbrokers, Guaranty Trust Bank’s trading system, or MT4 for forex.
Using these patterns lets you spot high-probability trades fast, especially when combined with support/resistance levels or volume analysis. For instance, recognising a Bullish Engulfing pattern near a key support can confirm an opportune buy signal in the Nigerian stock market. Plus, mastering these patterns sharpens your intuition, which is vital when news triggers sudden market reactions.
To wrap up, understanding candlestick patterns gives Nigerian traders an edge by simplifying complex price data and revealing market sentiment. It’s a skill that blends well with other tools and adapts to the local market’s quirks, helping you trade more confidently and smartly.
Understanding basic candlestick patterns is essential for traders aiming to read market behaviour clearly and make informed decisions. These patterns serve as visual cues to shifts in buying or selling pressure, often indicating potential price reversals or continuations. For Nigerian traders, recognising these patterns can mean the difference between catching a profitable move early or missing out due to cluelessness.
The Hammer and Hanging Man patterns look quite similar—they both have small bodies with long lower shadows—but their implications differ based on the preceding trend. The Hammer typically appears after a downtrend, signalling a possible bullish reversal as buyers step in aggressively. On the other hand, the Hanging Man appears after an uptrend, warning that sellers are gaining strength and a bearish reversal might be looming.
For example, if a stock listed on the Nigerian Exchange (NGX) has dropped for several days and suddenly forms a Hammer, it indicates potential support and might prompt you to consider entering a long position. Conversely, spotting a Hanging Man during a rally could be your cue to tighten stops or take profits.
These patterns also share a similar shape but differ based on trend context. An Inverted Hammer after a downtrend may point to a bullish reversal despite the upper shadow showing that sellers challenged buyers. Meanwhile, a Shooting Star after an uptrend often signals a bearish reversal as sellers push prices down from higher levels.
Consider the case of a commodity like crude oil, which Nigerian traders monitor closely. A Shooting Star appearing in charts during an oil price rally might hint at a price dip, urging caution. Similarly, an Inverted Hammer after a slump in a bank stock could encourage buying if supported by volume spikes.
Doji candles demonstrate indecision in the market when opening and closing prices are nearly identical, forming cross-like shapes. Their placement matters—a Doji after a clear trend can signal a potential reversal or pause in momentum. Variations like the Long-Legged Doji indicate heightened uncertainty, while Dragonfly and Gravestone Doji add context based on their shadows.
In Nigeria’s volatile market environment, seeing a Doji during low-trading phases can be a red flag or alert you to wait for further confirmation before committing capital.
Engulfing patterns consist of two candles where the second completely covers the first. A Bullish Engulfing pattern occurs when a small red (bearish) candle is followed by a large green (bullish) candle, signalling strong buying interest after sellers lost momentum. In contrast, a Bearish Engulfing appears when a smaller green candle is overtaken by a larger red candle, indicating selling pressure.
For Nigerian traders, spotting a Bullish Engulfing pattern on shares of a popular telco like MTN Nigeria might suggest an upward move, especially if formed near a support level. This cue can guide entry points or reinforce stop-loss settings.
These are also two-candle reversal patterns but depend on the closing position relative to the previous candle’s body. The Piercing Line shows a bullish reversal with the second candle closing above the midpoint of the prior bearish candle. Dark Cloud Cover signals a bearish reversal, where the second candle closes below the midpoint of the prior bullish candle.
Such patterns help Nigerian traders act swiftly—say, in trading agricultural commodity-linked stocks—before trends shift decisively.
These tri-candle patterns mark potential trend reversals. The Morning Star forms in a downtrend with a bearish candle, followed by a small indecisive candle (often a Doji), and then a bullish candle signalling upward momentum. The Evening Star, its bearish counterpart, appears after an uptrend with a bullish candle, an indecisive candle, then a bearish candle confirming selling pressure.
In practical terms, spotting a Morning Star on a banking stock after persistent declines could encourage buying, while an Evening Star during a bullish run might suggest scaling back.
These patterns involve three consecutive candles moving in the same direction. Three White Soldiers represent strong bullish momentum with three solid green candles closing progressively higher. Three Black Crows indicate strong bearish control with three red candles closing lower each time.
For Nigerian equity traders, seeing Three White Soldiers on a blue-chip stock like Dangote Cement signals confidence and possible sustained gains. Conversely, Three Black Crows might warrant a quick exit or hedging strategy.
Recognising these basic patterns equips you to read price charts like a pro, providing a foundation for more advanced trading strategies tailored to Nigeria’s unique market conditions.
By mastering these patterns—single, two-candle, and three-candle—you can sharpen your timing, manage risks better, and avoid common pitfalls. Remember, though, these signals work best when combined with other tools like volume analysis or support and resistance, which you will learn about in the next sections.
Candlestick patterns offer valuable clues about market sentiment, but relying on them alone limits a trader’s edge, especially in Nigeria's often volatile market. Combining these patterns with other technical tools sharpens entry and exit decisions, helping traders avoid false signals and maximise profits. Real-life trading in Nigerian equities or forex requires more than spotting a hammer or engulfing pattern — contextualising these signals with support levels, moving averages, and volume helps make smarter trades.
Support and resistance (S&R) levels mark price points where bullish or bearish pressure historically interacts. When a bullish candlestick pattern forms near a strong support level, it often signals a genuine buying opportunity. For instance, if a hammer appears at ₦250 on a stock that bounced several times at that price, traders can anticipate a price rally.
On the flip side, spotting a bearish pattern like a shooting star close to a known resistance level could warn of an impending drop. This blend of pattern and key price levels adds weight to trading decisions. Traders in Lagos or Abuja, for example, often watch these levels closely for stocks like Dangote Cement or MTN Nigeria to avoid chasing false breakouts.
Moving averages smooth price data over time, revealing trends that might not be immediately visible. A bullish candlestick pattern appearing above the 50-day moving average, confirmed by rising volume, is a stronger signal than the pattern alone. Rising volume shows commitment from traders, making breakouts or reversals more reliable.
For example, if the price of a Nigerian bank stock crosses above its 20-day moving average accompanied by a bullish engulfing candle and heightened volume, it suggests the uptrend might sustain. Such confirmations help traders avoid entering prematurely, a common pitfall in volatile Nigerian markets where news and external shocks can cause sudden swings.
No pattern guarantees success, so risk management remains key. Using stop-loss orders close to recent highs or lows protects capital if the market moves against your pattern-based forecast. Position sizing based on account size and volatility of Nigerian instruments ensures one loss won’t wipe out your gains.
Additionally, combining multiple confirmations before acting cuts down on false signals common in fast-moving markets like Nigerian equities or forex. Some traders also limit exposure during high-volatility periods — such as ember months — to avoid unnecessary risk.
Effective traders always blend candlestick patterns with other tools and manage risk carefully. This combined approach turns intermittent signals into consistent opportunities, especially in Nigeria’s dynamic trading environment.
In summary, integrating candlestick analysis with support/resistance levels, moving averages, volume data, and sound risk management equips Nigerian traders to make more informed and resilient trading decisions.
Understanding the common pitfalls in candlestick pattern trading is crucial for Nigerian traders who want to avoid unnecessary losses and maximise their success. These mistakes often arise from misapplication or misunderstanding of the patterns, leading to poor decisions that could have been avoided with more care and context.
One frequent mistake is depending solely on candlestick patterns to make trading decisions without waiting for other confirmations. For example, seeing a bullish engulfing pattern and instantly entering a trade without checking if it aligns with support levels, volume spikes, or moving averages can backfire. In the Nigerian market, where volatility sometimes spikes due to factors like fuel subsidy changes or CBN policy announcements, relying on a single candlestick signal is risky. Combining patterns with at least one other technical tool helps confirm if the signal is genuine, reducing false alarms.
Candlestick patterns do not exist in a vacuum. Ignoring the broader market context, including significant news events or economic indicators, often leads to misreading a pattern. Nigerian traders must consider data such as inflation rates released by the National Bureau of Statistics or election-related developments that often sway market mood. For instance, a hammer pattern during a period of political uncertainty might not mean a trend reversal as usual but could be a temporary pause caused by low liquidity. Staying updated on current events prevents traders from getting caught in misleading patterns during such times.
Sometimes the fault lies in how traders set up their charts rather than the candlestick patterns themselves. Using inappropriate timeframes or incorrect chart scales can distort pattern recognition. For instance, a shooting star pattern on a 1-minute chart may not hold the same weight on a daily chart. Nigerian traders often use platforms like MTN Protrade or Binance Nigeria, and adjusting the chart settings properly is vital. Ensuring clarity in candle intervals, removing unnecessary overlays, and selecting the correct time zone (WAT) helps traders read patterns accurately instead of forcing misinterpretations from messy charts.
Avoiding these mistakes sharpens your trading strategy, helping you make better-informed decisions in Nigeria's dynamic markets. Practice combining tools, stay aware of relevant news, and make sure your charts are set correctly – these steps go a long way.
By recognising and steering clear of these errors, Nigerian traders enhance their candlestick analysis' reliability and improve their chances for consistent profitability.
Mastering candlestick patterns goes beyond knowing what each shape means. For Nigerian traders, applying these patterns practically can make the difference between consistent profit and costly mistakes. This section shares tips tailored to our unique market, helping you use candlesticks effectively.
Selecting a trading platform with accurate and reliable charting tools is foundational. Many Nigerian traders opt for platforms like MTN MomoTrade, E-Trade, or international brokers offering NGN support. These platforms should provide crisp, real-time candlestick charts with adjustable timeframes and zoom features. Poor chart quality can blur crucial details, leading to misinterpretation of patterns such as dojis or engulfing candles.
Look out for platforms that allow you to overlay other technical indicators like moving averages or RSI, which are useful for confirming signals. For example, when trading on LSE or NGX shares, a platform that updates prices without delay ensures your candlestick analysis reflects current market sentiment, rather than outdated data.
Candlestick patterns work differently across timeframes. Short-term traders, such as day traders or scalpers, focus on 5-minute or 15-minute candles, while swing traders might watch daily or weekly charts. Patterns forming on a 1-minute chart might be noise, but the same pattern on a daily candle often carries more weight.
For Nigerian traders dealing with the frequent market pauses caused by local factors (like power outages or ember months volatility), it pays to understand how patterns behave in your chosen timeframe. For instance, a bullish engulfing pattern on a weekly chart for a stock like Dangote Cement can indicate a stronger reversal than the same pattern on an hourly chart. Adapt your strategy accordingly, combining timeframes to confirm setups.
One way to sharpen your skill is to keep a trading journal focused specifically on candlestick patterns. Record the pattern seen, the asset, timeframe, market conditions, and your trade outcome. This habit lets you identify which patterns work best within the Nigerian context or your personal trading style.
Say you notice that while morning star patterns often signal bullish reversals, they don’t always hold during times of political uncertainty or election cycles. Such insights come only through consistent documentation and reflection.
A well-maintained trading journal is like your personal trainer in the trading gym — it builds discipline, improves strategy, and reveals blind spots.
By following these practical tips, Nigerian traders can boost their confidence and success rate when using candlestick patterns. Remember, the markets here come with their own set of challenges and advantages; adapting your approach to these realities is key.
Discover 35 must-know candlestick patterns 📈 for smarter trading! Grab the handy PDF📄 to spot trends and boost your market skills today.
📊 Master all candlestick patterns to spot market shifts confidently. Essential for Nigerian traders aiming to enhance their trading decisions with clarity.
📈 Master 35 powerful candlestick patterns to read market moves confidently. Perfect for traders seeking clear, practical tips plus a handy PDF download.
📈 Master Nigerian trading with our detailed guide on candlestick patterns! Learn to read, interpret & make informed decisions plus handy PDF resources 📊
Based on 8 reviews