
Top Forex Trading Strategies for Nigerian Traders
Discover effective forex trading strategies for Nigerian traders 🇳🇬. Learn risk management, key tools, and approaches to boost your trading success 📈.
Edited By
Michael Reid
Forex trading images are essential tools for anyone involved in currency markets. They go beyond pretty graphics; they’re windows into market behaviour, helping traders, analysts, and brokers make sharper decisions. In Nigeria, where digital tools and internet accessibility are growing, understanding these visuals is a big deal for making money in forex.
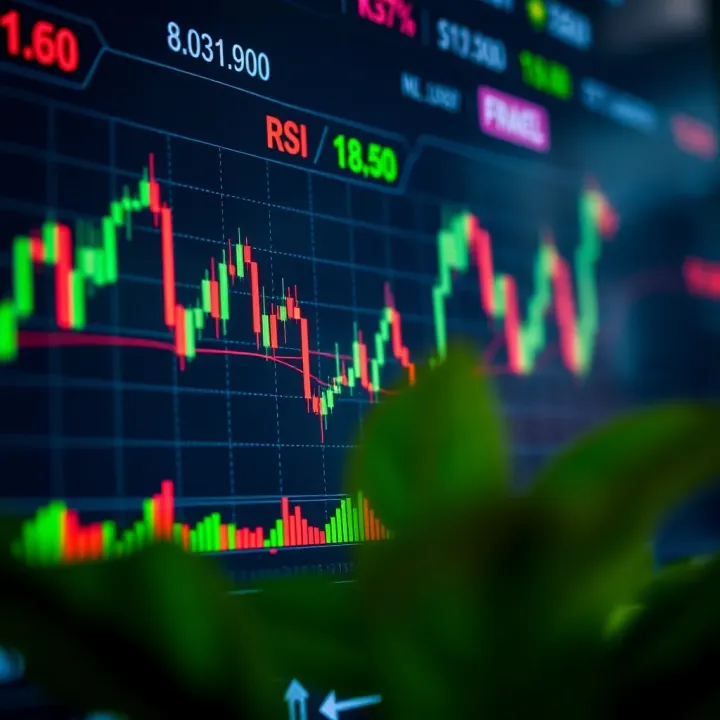
These images mostly come in the form of charts—candlestick, line, and bar charts are the most common. Each chart type reveals different details. For example, candlestick charts show open, close, high, and low prices within specified times, making it easier to spot price momentum or reversal patterns. On the other hand, bar charts highlight price ranges and trading volume, which can tell you about market strength.
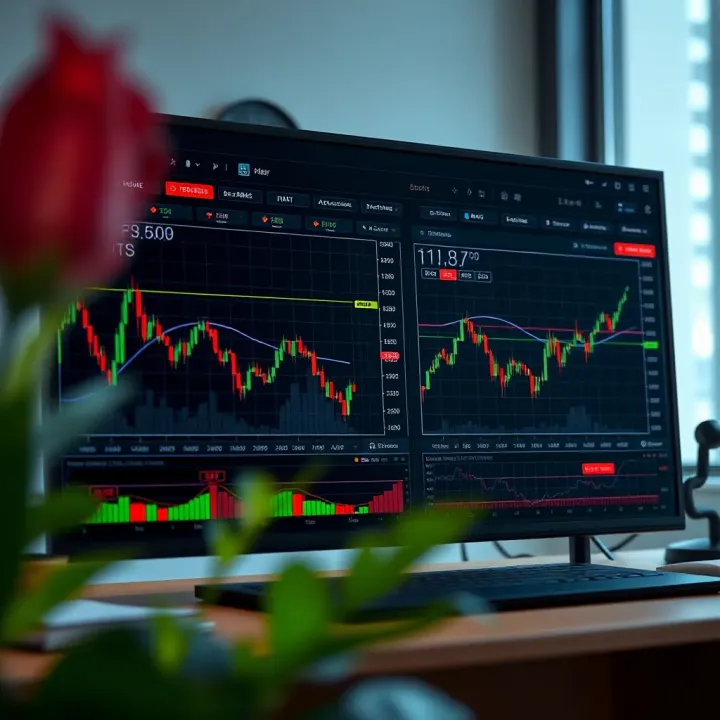
Effective reading and interpretation of these images can mean the difference between profit and loss in volatile markets like forex.
Traders in Nigeria often use these visuals alongside key indicators such as Moving Averages, Relative Strength Index (RSI), and Bollinger Bands. These indicators show trends, market strength, and possible price breakouts. For instance, spotting an RSI above 70 can signal that a currency pair is overbought and might soon drop, helping traders avoid losses.
Thanks to fintech platforms like MTN’s MoMo Agent or OPay offering easy access to forex apps, Nigerians have better reach to quality forex visuals. Plus, modern software allows customisation of charts to suit specific strategies. This means a day trader can set short intervals while a long-term investor might monitor weekly trends. The clarity and custom options reduce guesswork, especially for traders dealing with multiple currency pairs.
To sum up, forex trading images are not just decorative; they are vital for analysing currency moves. Understanding how to read these visuals, combined with Nigeria’s growing tech access, empowers traders to make informed, confident decisions.
This piece will further explore types of forex images, their core indicators, and tech tools that Nigerian traders can use to navigate the forex space effectively.
Forex trading images serve as vital visual tools that translate complex market data into understandable formats. They provide traders with a snapshot of currency price movements, buying and selling pressures, and market sentiment at a glance. For Nigerian traders, these images help break down fast-changing market conditions into practical intelligence that influences timely decisions.
Candlestick charts are among the most popular visuals in forex trading. Each "candlestick" displays the opening, closing, highest, and lowest prices within a chosen period, such as a minute, hour, or day. Nigerian traders find candlestick charts handy for recognising market sentiment because the body colour indicates bullish or bearish trends. For instance, a green (or white) candle suggests upward movement, while a red (or black) candle signals downward pressure.
These charts highlight patterns like "doji" or "hammer," which can hint at potential reversals. A trader in Lagos, following the US dollar/naira pair, can spot such patterns to decide when to enter or exit trades, thus avoiding impulsive buys during choppy market phases.
Line charts provide a simple overview by connecting closing prices over a period, offering a clear trend direction without clutter. This is beneficial for traders needing quick visual cues, such as those doing long-term analysis or focusing on major support or resistance levels.
Bar charts, on the other hand, resemble candlesticks but show price range and closing price through vertical bars and ticks. They offer more detail than line charts but are less visually dense than candlesticks. Nigerian traders keen on intraday fluctuations often use bar charts to gauge volatility and fine-tune their entry points.
Heat maps display currency strength or weakness using colours, often ranging from green (strong) to red (weak). They give a quick, intuitive feel of which currencies are gaining momentum globally. For Nigeria-based traders tracking multiple currency pairs, heat maps simplify comparing strength across several pairs without analysing individual charts.
Market sentiment graphics, such as trader positioning indicators, show whether the majority of traders are long or short in a particular pair. This helps Nigerian traders avoid herd mentality traps and gauge contrarian opportunities, especially during volatile ember months when speculative trading surges.
Images like charts translate thousands of market ticks into understandable formats. They help Nigerian traders see the story of price movement—zooming in on steady climbs or sharp drops. This visual interpretation saves time and aids in grasping real-time market dynamics.
For example, a Lagos-based trader watching the EUR/USD pair can quickly evaluate the latest price swing instead of sifting through raw numerical data, which would be unmanageable in fast markets.
Charts reveal crucial trends—whether an upward, downward, or sideways market movement. Visual patterns, such as "head and shoulders" or "double tops," alert traders to potential reversals or breakouts.
Being able to spot these trends early empowers Nigerian investors to adjust their strategies accordingly. For instance, recognising a strong upward trend in the GBP/USD pair might encourage a long-term investment, while a potential reversal pattern in USD/NGN could signal caution.
Visual data condenses complex information into actionable insights. Nigerian traders combine price patterns with indicators on charts to confirm entry and exit points. This reduces guesswork and emotional trading.
Moreover, clear charts prevent hasty decisions driven by market noise. If a trader sees confirming signals across candlestick patterns and volume bars, they’re more confident placing trades. This discipline is particularly valuable where internet speed and device limitations affect access—clear images allow faster, better decisions.
Forex trading images are not just fancy graphics—they transform raw numbers into meaningful signals, giving Nigerian traders an upper hand in fast-moving currency markets.
In summary, forex trading images cover various chart types and sentiment visuals that help traders analyse price behaviour. They ease the process of spotting patterns and making informed trading decisions, especially critical in the dynamic Nigerian market environment.
Forex trading images pack several key elements that help traders understand market behaviour and make informed decisions. These visuals typically display price indicators, charting tools, and technical analysis indicators—each serving a specific purpose in guiding a trader's actions.
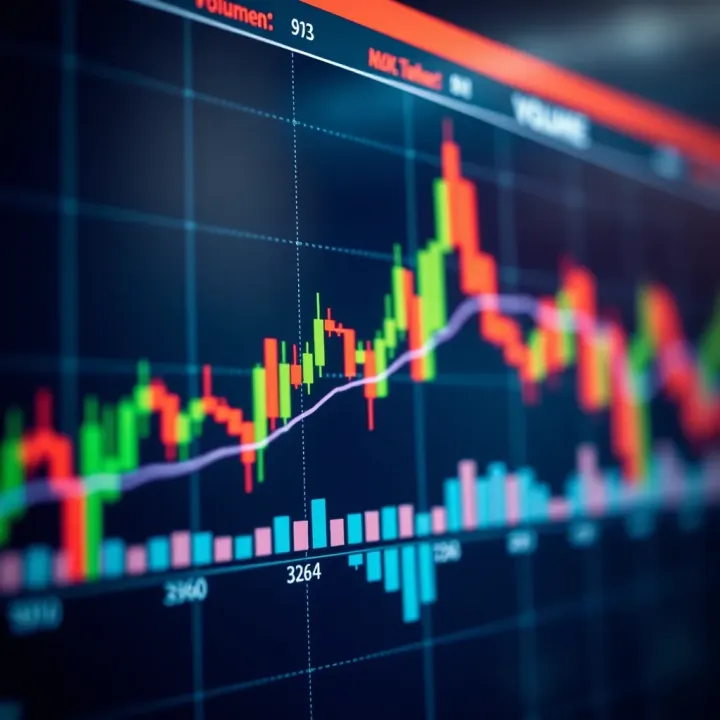
Support and Resistance Levels are crucial in forex charts because they mark price points where currency pairs typically stop moving further up or down. Support is the price floor where buying interest tends to push prices higher, while resistance acts like a ceiling where selling pressure usually halts advances. For example, if the USD/NGN pair repeatedly bounces back after hitting ₦460, that level becomes a strong support point showing buyers are active around there. Traders watch these levels to time their entry or exit to avoid unnecessary losses.
Moving Averages smooth out price data to highlight trends over time. By averaging prices over specific periods—like 20, 50, or 200 days—moving averages help traders spot whether the market is bullish or bearish. For instance, if the shorter 20-day moving average crosses above the 50-day moving average on a chart, it often signals the start of an upward trend, and Nigerian traders might consider buying at this point. Moving averages are also helpful in spotting price pullbacks and planning targets.
Volume Indicators show the amount of trading activity during a set period. High volume often confirms the strength of a price movement, while low volume can warn of weak trends. Consider a situation during an ember months’ trading where the volume rises sharply as the naira drops against the dollar; this can imply a strong sell-off, alerting traders to potential volatility. Knowing volume patterns helps traders avoid getting stuck during fakeouts or weak breakouts.
The Relative Strength Index (RSI) measures how overbought or oversold a currency pair is. RSI values range from zero to 100, with levels above 70 suggesting overbought conditions and below 30 indicating oversold. For example, if the RSI on the BTC/USD chart rises above 70, it might hint at a reversal soon as buyers get exhausted. Nigerian traders use RSI as a quick gauge to exit or enter trades, especially in volatile markets.
MACD (Moving Average Convergence Divergence) tracks the relationship between two moving averages to reveal momentum shifts. When the MACD line crosses above the signal line, it indicates bullish momentum, while a cross below signals bearish momentum. For instance, during a heated forex session, a MACD crossover might confirm a buy signal that traders are waiting for before committing their funds.
Bollinger Bands consist of a moving average and two bands above and below it that represent standard deviations. When price hits the upper band, the asset might be overbought; when it touches the lower band, it may be oversold. Nigerian traders following USD/EUR pairs watch Bollinger Bands to detect periods of high volatility or consolidation, helping them plan their moves accordingly.
Understanding these elements on forex trading images isn't just for tech-savvy investors; they offer practical, visual insights that can enhance trading decisions, especially in fast-moving markets like Nigeria's.
Traders who get familiar with these indicators and how they appear on different charts can better interpret what the market is saying. That said, no single tool tells the whole story—combining them wisely boosts your chances of success in forex trading.
Forex trading images are essential tools for Nigerian traders who want to make better decisions in a fast-moving market. Using the right charts and interpreting signals correctly can improve your chance of success. Images organise complex price data visually, helping you spot opportunities or risks clearly and quickly.
Traders in Nigeria often choose between day trading and long-term investing based on their time availability and risk tolerance. Day traders look for quick price moves within minutes or hours. For this, they need real-time charts with short time frames, such as 1-minute or 5-minute candlestick charts. These show detailed price action, allowing swift entry and exit.
On the other hand, long-term investors focus on bigger trends spanning weeks or months. They use charts with daily or weekly time frames to understand broader patterns and avoid noise from small price fluctuations. For example, a Lagos-based investor saving towards retirement may focus on weekly charts to hold trades safely over months. Picking charts that suit your style is crucial because the wrong one can cause confusion or missed signals.
Candlestick charts are popular among Nigerian traders because they reveal more information than simple line charts. Each candle shows open, high, low, and close prices, enabling traders to spot specific patterns like tops, bottoms, or reversals. This makes candlesticks very useful for detailed technical analysis.
Line charts connect closing prices over time, offering a cleaner and simpler view of general direction. They are helpful for beginners or long-term investors who want to avoid clutter. For instance, if you are trading on the go using your smartphone in Abuja, a line chart may provide a quick sense of market trend without overwhelming detail.
Forex trading images help traders identify when a price trend might end or accelerate. A reversal signals a change from an uptrend to a downtrend or vice versa. By recognising patterns like double tops, head and shoulders, or hammer candlesticks on images, Nigerian traders can act early to secure profits or limit losses.
Breakouts occur when price moves beyond a resistance or support level shown on the chart. This often signals the start of a strong move. For example, if the price breaks above a resistance line on a GBP/USD chart, it may attract more buyers. Spotting such breakouts through images can give traders the edge needed before the market moves heavily.
Charts often include technical indicators to strengthen trade decisions. Indicators like Relative Strength Index (RSI) or Moving Average Convergence Divergence (MACD) shown on images help confirm whether the market is overbought, oversold, or gaining momentum.
In Nigeria, where market news can be unpredictable, relying solely on price movement without indicators may mislead. Using an RSI below 30 together with a bullish candlestick pattern, for example, confirms a possible buying opportunity. Combining image signals reduces guesswork and helps traders enter and exit trades with greater confidence.
A common error Nigerian traders make is trusting just one indicator or chart pattern without checking others. For example, buying based only on the MACD crossing may result in losses if the overall trend is weak. Indicators should support each other to create a clearer picture.
Relying too much on a single signal can give false alarms, especially in volatile markets like forex, which respond to global events. Successful traders cross-check multiple indicators and price action on images before making decisions.
Another frequent mistake is mixing signals from different time frames without understanding their impact. A trade setup that looks promising on a 5-minute chart can be insignificant on the daily chart. Nigerian traders often get confused when short-term and long-term trends conflict.
Similarly, using distorted chart scales can exaggerate price changes, leading to wrong interpretations. Always ensure proper time frame and scale settings on your trading platform to avoid misjudging market conditions. A well-adjusted chart helps keep perspective and avoid impulsive trades.
Using forex trading images effectively is not just about seeing price movements but understanding what those movements say about market sentiment. Nigerian traders who master chart selection, signal interpretation, and avoid common pitfalls will better navigate the complexities of forex markets and improve profitability.
By combining the right visuals with practical skills, you can turn complex data into clear trading plans tailored for your unique style and Nigeria’s market conditions.
Technology shapes how Nigerian traders access and interpret forex trading images. Reliable platforms with clear, detailed visuals make a real difference in understanding market moves and making swift decisions. For traders in Nigeria, picking the right tool means balancing accessibility, quality of graphics, and ease of use given local conditions such as internet reliability.
MetaTrader 4 (MT4) and MetaTrader 5 (MT5) dominate forex trading globally and in Nigeria. These platforms offer an extensive range of charting tools including candlestick, line, and bar charts, with various indicators built-in. MT4 remains popular for its simplicity, while MT5 adds more features such as advanced orders and timeframes.
What stands out for Nigerian traders is that MT4 and MT5 support custom indicators and automated trading through Expert Advisors. This allows users to tailor visual analysis and execute trades based on signals derived from charts. For instance, a day trader in Lagos can set alerts on MT5 for breakouts visible on candlestick charts, making timely decisions during busy market sessions.
TradingView offers web-based charts with high customisability and an active community sharing ideas. Nigerian traders benefit from its ease of access as no download is needed, just internet. The platform provides crisp, dynamic charts with numerous indicators and drawing tools, useful for both beginners and experts.
One practical edge of TradingView is its social features—traders can see real-time shared insights and screenshots that explain market trends visually. This arrangement helps Nigerian traders stay connected with global market sentiment and deepen their technical analysis skills.
Several Nigerian fintech and trading firms now provide platforms with integrated forex charts tailored for the local market. These platforms, sometimes combined with mobile wallets or payment services, streamline local naira trading and cross-border forex analysis.
For example, some local apps offer direct chart views of USD/NGN alongside other forex pairs, offering colours and indicators suited for rapid decision-making in the Nigerian context. Their advantage lies not just in visuals, but also in tying charts to local market info, like CBN rates, giving traders in Nigeria a fuller picture.
Mobile devices have become the main way many Nigerians monitor forex markets. Platforms like MT4, MT5, and TradingView have mobile versions allowing traders to pull up charts anywhere—be it during a danfo ride or at a mama put.
Quick zoom, scroll, and tap features mean traders can spot trend changes or resistance levels while on the move. This flexibility improves reaction times in volatile markets where price can shift within minutes.
Not every area in Nigeria enjoys steady high-speed internet. Slow connections can disrupt the loading of detailed forex charts, leading to delays or pixelated images which make analysis difficult.
Lower display quality on some entry-level phones also matters. Charts with many small details or indicators may become cluttered or unreadable, putting traders at a disadvantage. This means picking simpler chart types and avoiding heavy custom indicators can be wiser when mobile or network constraints exist.
For Nigerian traders, matching platform features with local tech realities enhances both the enjoyment and profitability of forex trading. Knowing your tools well means you don't just trade blind, but with clarity and confidence.
By focusing on platforms that align with Nigerian circumstances—combining robust visuals, mobile friendliness, and internet considerations—traders can maximise their edge in the fast-moving forex arena.
In Nigeria's growing forex market, the future of trading visuals promises a significant shift, driven by improved technology and smarter data analysis. As local traders become more sophisticated, the role of visual data—charts, indicators, and real-time graphs—will deepen, shaping how investors make decisions. Practical tools that can read and present market data accurately will be vital for navigating the often volatile foreign exchange landscape here.
Automated Pattern Recognition has become a game-changer in forex trading. Machines now scan charts to spot classic patterns—like head and shoulders, triangles, or double tops—faster and more reliably than human eyes. For Nigerian traders, this means reducing guesswork and fast-tracking signals that might otherwise be missed amid market noise. For instance, a local trader using platforms like MetaTrader 5 can receive alerts about emerging patterns, enabling quicker entry or exit.
Similarly, Sentiment Analysis through Visual Cues taps into how market sentiment shifts, using data from news, social media, and price action presented visually. This approach helps traders gauge whether optimism or fear dominates, which often drives currency moves. A concrete example is when naira experiences sudden swings after a political event; sentiment visuals can highlight these shifts before they fully reflect in prices, giving traders a chance to adjust strategies appropriately.
With technological advances, Improved Training Materials are becoming more interactive and visual. Nigerian educators can now use animated charts and AI-driven illustrations to teach forex concepts, making complicated ideas like Fibonacci retracements or MACD crossovers easier to grasp. This development enhances understanding, particularly for beginner or intermediate traders who struggle with purely text-based lessons.
Plus, Wider Access to Professional Visual Tools is booming. Many platforms now offer mobile-friendly, high-quality charting with affordable or even free options for Nigerian users. For example, TradingView's cloud-based charts are accessible on smartphones, ideal for traders facing unreliable power or internet disruptions common in Lagos or Kano. This access bridges the gap, allowing more traders to apply professional analysis techniques that were once limited to seasoned brokers or institutions.
Enhanced visual data and AI-driven tools are set to make forex trading more accessible and effective for many Nigerian traders, transforming how they learn, analyse, and act in the market.
In summary, the future of forex trading images in Nigeria hinges on advances in AI and technology, coupled with better educational resources and wider access. These trends will empower traders with sharper insights and quicker decisions, especially in a market that demands agility and precision.
Discover effective forex trading strategies for Nigerian traders 🇳🇬. Learn risk management, key tools, and approaches to boost your trading success 📈.
📈 Discover the best times for forex trading in Nigeria by understanding global sessions, key currency pair activities, and strategies to manage risks effectively.
Discover top forex trading indicators 📊 tailored for Nigerian traders 🇳🇬. Learn how to combine tools for smarter, more accurate trading decisions!

📈 Discover practical forex trading insights and proven strategies tailored for Nigerian traders. Master risk, choose brokers wisely, and thrive in local markets.
Based on 15 reviews